Growth can hide a lot of variation.
One location keeps its schedule full and recall moving. Another spends hours chasing overdue patients and trying to refill cancellations. Collections may look solid across the organization while aging A/R builds quietly at a few locations.
For DSO leaders, the challenge is knowing which differences are normal and which are costing the organization time, capacity, and revenue.
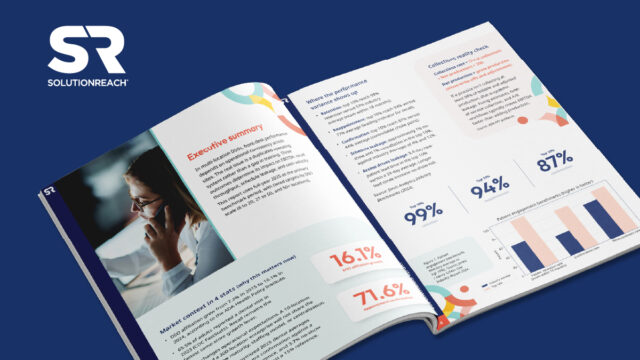
The DSO Benchmark Report 2026 gives you a clearer way to compare performance. It connects 12 front-desk and financial KPIs to three areas that have a direct impact on DSO performance: recall, schedule leakage, and cash flow.
Solutionreach dental customers, for example, averaged a 71.6% appointment confirmation rate in 2025, compared with a 50% internal industry reference.
The report goes beyond confirmation, with benchmarks and planning targets that can help you spot performance gaps across locations and decide where to focus first.
GET THE FULL DSO BENCHMARK REPORT + SCORECARD →
How much revenue can a DSO lose to schedule leakage?
An open chair may not seem like a major problem when you’re looking at one location or one day. Across a multi-location group, those openings add up quickly.
Schedule leakage is the appointment capacity lost when no-shows and cancellations aren’t refilled.
Consider a 20-location DSO averaging 35 appointments per location per day. Reducing schedule leakage by six percentage points — from 18% to 12%, for example — could recover roughly 10,000 appointments a year.
At $250 in net production per appointment, that’s approximately $2.5 million in annual production capacity.
What a 6-point leakage improvement could mean
| Locations | 20 |
| Appointments per day | 35 |
| Leakage reduction | 6 points |
| Recovered appointments | ~10,000 annually |
| Production capacity | ≈ $2.5M annually
|
Illustrative ROI model. Actual results vary based on schedule volume, appointment value, working days, cancellation patterns, and refill rates.
Reducing leakage takes more than sending additional reminders. Look at what happens after a patient doesn’t confirm or cancels. Is there a clear process? Does the waitlist get used consistently? How quickly does the team try to fill the opening?
Those workflow differences can matter as much as the reminder itself.
What’s a realistic appointment confirmation rate for a DSO?
There’s no single confirmation rate that applies to every DSO. Before comparing locations, make sure everyone is using the same definition of “confirmed.”
As a reference point, Solutionreach dental customers averaged a 71.6% appointment confirmation rate in 2025, compared with a 50% internal industry reference.
Confirmation is also a metric teams can influence directly. Common areas to review include message timing, two-way texting, follow-up on unconfirmed appointments, escalation rules, and the process for refilling canceled appointments.
A strong confirmation process protects the schedule without requiring staff to reinvent the workflow every time the front desk gets busy.
How many recall appointments should a dental location generate each quarter?
Recall represents growth that already exists within your patient base.
When patients leave without scheduling their next visit or overdue patients remain untouched on a recall list, the effects often don’t show up immediately. Months later, the hygiene schedule starts to thin.
Solutionreach dental customers averaged 48.6 recall appointments per location per quarter in 2025, compared with an internal industry reference of 30. They also averaged approximately $17,000 in recall revenue per location per quarter, compared with a $10,000 internal reference.
For DSOs focused on same-store growth, recall deserves close attention. The number of patients on a recall list matters less than how reliably each location converts those patients back into scheduled care.
Why does front-desk performance vary between locations in the same DSO?
Many DSOs grow by acquiring practices that already have their own systems and habits.
One location may count a late cancellation as a no-show. Another may not. Definitions for active patients, write-offs, reappointment, and confirmation can also vary.
That creates a basic reporting problem: two locations may appear to perform differently even though they aren’t measuring the same thing.
Before using benchmarks to compare teams, standardize the definitions behind the numbers.
Standardize the measure before the coaching
| When definitions vary | When definitions are standardized |
| Leaders question whether comparisons are valid. | Leaders can compare locations with more confidence. |
| Coaching reacts to inconsistent symptoms. | Coaching can address a clearly defined gap. |
| Local workarounds are harder to see. | Workflow differences become easier to identify. |
| Scorecards can feel arbitrary. | Scorecards give teams a shared operating language. |
The full benchmark report includes KPI definitions and formulas that can help locations measure performance consistently before they’re ranked against one another.
SEE WHERE YOUR LOCATIONS STAND — GET THE REPORT + 12-KPI SCORECARD →
What should a DSO do first after reviewing benchmark results?
Start with the data.
During the first 30 days, align KPI definitions, establish a reliable baseline, and identify the gaps that deserve the most attention. Schedule leakage can be a useful starting point because changes are relatively easy to see and measure.
The report recommends a phased approach:
Days 0–30: Stabilize and measure. Align definitions, map workflows, and establish reliable baselines.
Days 31–60: Measure and coach. Share results, identify the largest gaps, and coach teams on one priority at a time.
Days 61–90: Enforce and scale. Set minimum operating standards and create focused remediation plans where performance continues to lag.
Locations with two or more at-risk metrics may need a 30-day remediation plan. Gaps in net collections, A/R ratio, or 90+ day A/R deserve faster attention because of their effect on cash flow.
A phased rollout also gives teams time to understand the numbers and the expectations behind them before the scorecard becomes an accountability tool.
How does DSO size affect benchmark targets?
A 10-location organization and a 200-location enterprise don’t have the same resources or operating structure.
Larger DSOs may have centralized teams, specialized roles, shared services, automation, and more standardized reporting. Smaller organizations may depend more heavily on local workflows and individual staff members.
The report organizes DSOs into three operating tiers:
- Emerging: 6–20 locations
- Growth: 21–50 locations
- Enterprise: 50+ locations
The point isn’t to make every organization operate like the largest DSO. It’s to set realistic targets based on scale while continuing to improve consistency across locations.
Why these DSO benchmarks matter now
Front-desk performance shows up later in production, capacity, and cash.
Low reappointment can leave future hygiene schedules open. Weak confirmation puts scheduled capacity at risk. Missed calls can mean lost demand before an appointment is booked. Inconsistent estimates and collection processes can push more revenue into A/R.
When those gaps repeat across dozens of locations, even modest differences can have a meaningful financial impact.
At the same time, DSOs are managing continued staffing pressure, rising labor costs, patient-access challenges, and a larger patient-pay burden. That makes consistent front-desk processes increasingly important.
Benchmarking helps leaders narrow the focus. Instead of asking every location to improve everything at once, you can identify where performance varies most and put resources behind the problems that matter.
What’s in the full DSO Benchmark Report?
The complete report includes:
- A 12-KPI scorecard covering retention, recall, scheduling, access, collections, A/R, and staff efficiency
- Top-tier, competitive, and at-risk score bands
- A 0–24-point location scoring framework
- Planning targets for Emerging, Growth, and Enterprise DSOs
- KPI definitions and formulas for more consistent measurement
- A 30/60/90-day operating playbook
- An illustrative schedule-leakage ROI model
- A cost-of-inaction framework
- Practical guidance for recall, confirmation, collections, phone access, staffing changes, and M&A integration
Find the gaps across your locations and decide where to focus first.
GET THE 2026 DSO BENCHMARK REPORT + SCORECARD →
Frequently Asked Questions About DSO Benchmarks
What is a good appointment confirmation rate for a dental practice?
A useful target depends on how your organization defines and records confirmation. Solutionreach dental customers averaged 71.6% in 2025, compared with a 50% internal industry reference. Use one definition across locations, establish your baseline, and set improvement targets from there.
How is schedule leakage calculated for a dental office?
Schedule leakage measures appointment capacity lost when no-shows or cancellations aren’t refilled. Divide unfilled no-shows and cancellations by total scheduled appointments, then multiply by 100. Use the same definitions and refill rules at every location.
What’s the difference between a no-show rate and a cancellation rate?
A no-show is an appointment where the patient doesn’t arrive. A cancellation is an appointment canceled before the visit according to your organization’s defined window. Track them separately to understand the causes, then consider both when measuring total schedule leakage.
How many locations count as a DSO?
There’s no universal minimum. The DSO Benchmark Report is designed for groups with six or more locations and uses three planning tiers: 6–20, 21–50, and 50+ locations. Ownership structure, shared services, and operating infrastructure also affect how a group functions.
What net collections rate should a healthy dental practice target?
The report uses 98% or higher as its top-tier benchmark for net collections, calculated as total collections divided by net production. Payer mix, adjustments, and payment timing can affect the metric, so use the same calculation at every location.
How long should a new patient wait for a first appointment?
The report uses seven days or less as its top-tier benchmark. An external benchmark cited in the report found a 5.4-day lead time among top performers versus a 39-day industry average. Market conditions and appointment type can affect access, so use lead time mainly to identify capacity constraints.
Why can front-desk KPIs decline after staff turnover?
Turnover can disrupt established processes for confirmation, recall, collections, and follow-up. Documented workflows, clear ownership, and automation for repetitive tasks can reduce the amount of performance that depends on one experienced employee.
How do you benchmark locations that use different practice management systems?
Start with common KPI definitions and reporting periods. Map each system’s data to those definitions and validate a sample before comparing locations. If two systems calculate a metric differently, resolve the difference before using the numbers to compare performance.
What’s a reasonable recall rate for a 12-month period?
The report considers 20% or higher top tier and 14%–19.9% competitive. Planning targets also vary by DSO size. Whatever target you use, apply the same active-patient definition and count completed recall visits consistently.
How much does missed call volume cost a multi-location dental group?
There’s no universal figure. The cost depends on qualified call volume, answer rate, booking conversion, and appointment value. A February 2026 multi-location dataset cited in the report recorded a 62% call-answer rate and 40% conversion among answered calls, showing why phone access is worth measuring alongside other capacity KPIs.
Put the benchmarks to work across your DSO
The benchmark gives you the comparison. The full report gives you the tools to apply it across locations.
Get the DSO Benchmark Report 2026 for the complete 12-KPI scorecard, tier-based planning targets, KPI definitions, and 30/60/90-day playbook.

Your missed-call problem may be bigger than you think.
Use the guide to put a number on it.